Datadog Typesense Custom Agent Check

At Misfits Market we recently moved from a combination of a self hosted Prometheus/Loki/Grafana setup, along with some other external tools to Datadog as our all in one monitoring platform.

While Datadog offers 500+ builtin integrations, there will be the occasional service that you use that won’t be covered. Luckily it is fairly easy to write a custom agent check (or even a full on integration).

One integration we were missing was for our search engine Typesense. So I put together a quick custom agent check. I would like to possibly write an actual integration for it someday but I just wanted to get something off the ground quickly.

You can find it on Github here.

Install

Check Location

Upload the check script typesense.py to /etc/datadog/checks.d/typesense.py.

Configure

Create a configuration file located at /etc/datadog/conf.d/typesense.yaml. Check typesense.yaml in the repo as an example.

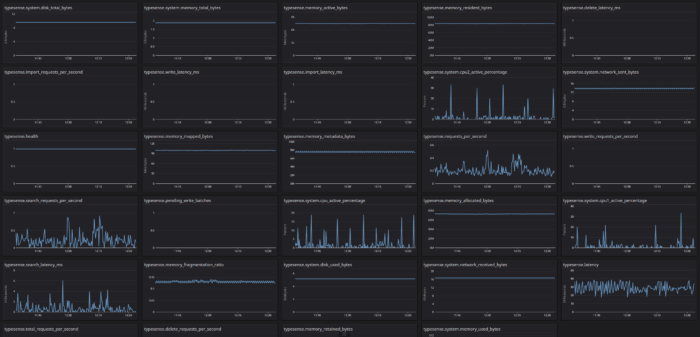
Screenshot

Example of some of the metrics.

Tag EBS Volumes With Last Attached Instance

Every so often you may find yourself with an unattached EBS Volume laying around not knowing what instance it belonged to.

You can use CloudTrail to find this information, but if you have not setup anything beyond the default trail you will only have 90 days of history.

Here is a small and simple Lambda that will add a new tag to all your EBS volumes with the the name of the instance they are currently attached to. This will allow you to see the last known instance that a volume was attached to.

The Lambda

Add the following code to a Python (tested with 2.7 and 3.6) Lambda:

We will need to attach the following policy to the Lambda so that it can do its job properly:

CloudWatch Rule

The easiest way to schedule this to run is to setup a CloudWatch rule. Much like a cron we can set this to run as often as we would like. We can even use cron expression to schedule it. Then select the Lambda we created as the target.

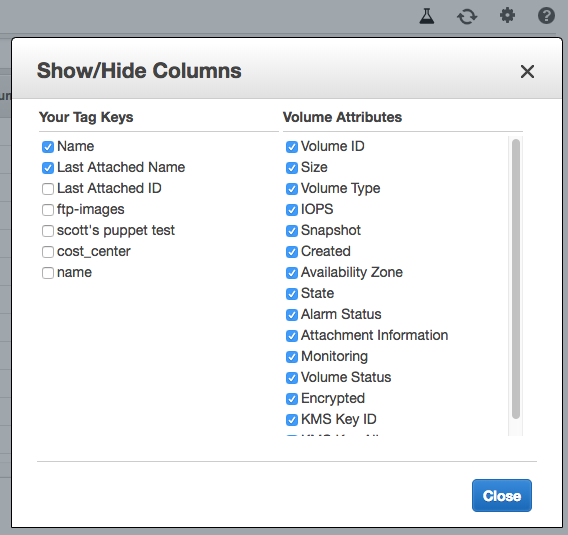
Once we have created the CloudWatch rule we should see new tags on our EBS volumes with information about their attachment once it has ran. We will need to click the gear icon on in the EC2 console so that it will show our new tag.

Now we should see our new tag(s):


Replication Between Separate Aurora Clusters

We are currently performing a large cross-account migration which involves migrating a rather large Aurora cluster. To do this smoothly I wanted to replicate to the new cluster in the new account from the existing cluster in the old account.

AWS does have official documentation on this here, but I found I was able to do this without having to dump and re-import the database, which is nice with a 600+ gig database.

Here are the steps I took to do this. I would still recommend reading the official documentation from AWS on this topic.

Enable Binary Logging / Set Retention

Binary logging will need to be enabled on the existing cluster. This is done in the Aurora cluster’s “DB cluster parameter group” by updating the “binlog_format” parameter. I set this to “Mixed” and that is recommend format unless you have a specific need for another format.

After you make this change you will need to reboot your cluster for it to take effect.

You can check to see if this has taken effect by connecting to the “Writer” in the cluster and running show global variables like 'binlog_format'.

Expected output:

MySQL [(none)]> show global variables like 'binlog_format';
+---------------+-------+
| Variable_name | Value |
+---------------+-------+
| binlog_format | MIXED |
+---------------+-------+

1 row in set (0.00 sec)

Now that binary logging in enabled we can set the retention time for the binary logs with the following command:

CALL mysql.rds_set_configuration('binlog retention hours', 144);

This will retain the binary logs for 144 hours (6 days). You can modify this as needed up to a max of 2160 hours (90 days). 144 hours should be more then enough for our needs.

Create Snapshot

After binary logging is enabled and retention is set we can take a snapshot of our existing cluster. Make sure to take a snapshot of the instance that is the “Writer”. (Note: Make sure followed the steps above to enable binary logging before creating the snapshot).

You can now share the snapshot with the new account. You can see specific instructions on how to do that here.

Once the snapshot is shared with the new account you can now restore the snapshot to a new Aurora cluster.

Restore Snapshot / Create New Cluster

Important Note: You must make sure that binary logging is also enabled the DB cluster parameter group for the new cluster you are creating. This will allow us to get the snapshot’s position in the binary log.

Depending on the size of the snapshot it may take some time for the instance to restore. Once the new cluster is up and running you will want to check the “Recent Events” for an event like the following:

Binlog position from crash recovery is mysql-bin-changelog.000002 85340883

Take note of this as we will use it to start up replication.

Create Replication User / Check Access

A user must be created for the new cluster to use to replicate from the original cluster. Creating a MySQL user is outside the scope of this post, but AWS has examples in the official docs here.

The important thing is that the user has the “REPLICATION CLIENT, REPLICATION SLAVE” global privileges.

You will also want to make sure that your new Aurora cluster can reach the existing cluster. You may have to modify security group access for this. We peered our VPCs to make the migration easier.

Start Replication

We are now ready to start up replication! Since this is Aurora setting up and enabling replication is a little different then vanilla MySQL/MariaDB. We use a couple stored procedures to do this.

Use the binlog file and position we got from the “Recent Events” to set master information.

Example:

CALL mysql.rds_set_external_master ('existing-cluster-old-account.cluster-ro-dasodjfja.us-east-1.rds.amazonaws.com', 3306, '<repl_user>', '<password>', 'mysql-bin-changelog.000002', 85340883, 0);

Now that is set we are ready to start replication:

CALL mysql.rds_start_replication;

You can then check the status of the replication with:

MySQL [(none)]> show slave status\G;

Hopefully everything should now be replicating. As mentioned before if you have any issues I would recommend taking a look at the AWS documentation on this topic.
Youtube/Twitch Video Stuttering While Gaming Caused By Windows 10 “Game Mode”

As I mentioned in my last blog post I just recently built a new PC. It is a pretty powerful PC (9900k, 2080TI, 32GB RAM) but I noticed I had a weird issue when playing games.

When attempting to watch a Youtube video or a Twitch stream while gaming the video would stutter. Also when attempting to stream “The Division 2” Streamlabs OBS would only get ~15FPS (while the game was running at ~110FPS).

If I clicked out of the game so that it lost focus everything start running fine until the game had focus again.

After some digging I found out this was caused by Windows 10 “Game Mode”.

Disabling “Game Mode”

  1. Press the Start button, then select Settings.
  2. Choose Gaming > Game Mode.
  3. Turn Game Mode On or Off.

What does “Game Mode” do?

Microsoft lists here that Game Mode does two things:

  • Prevents Windows Update from performing driver installations and sending restart notifications.
  • Helps achieve a more stable frame rate depending on the specific game and system.

I am unsure what it exactly means by the 2nd bullet point, but I am guessing it just causes the game to run at a higher processes priority then then everything else on your system.

When I switched this off I saw no change in performance for my game, and everything started running smooth outside of it.

What else could it be?

When searching around this issue a common thing that would come up is that if you have multiple displays running at different refresh rates this could cause an issue. This was not the case for me since both of my monitors are 144hz, but could be the case for you if your monitors have different refresh rates.

Monitoring My Windows Desktop/Gaming PC With Prometheus

Last week I built a new PC for general desktop use and also for gaming. Since I am a huge monitoring nerd I wanted to get it setup in Prometheus so that I could monitor everything including temperatures (since I am doing a bit of overclocking for the first time).

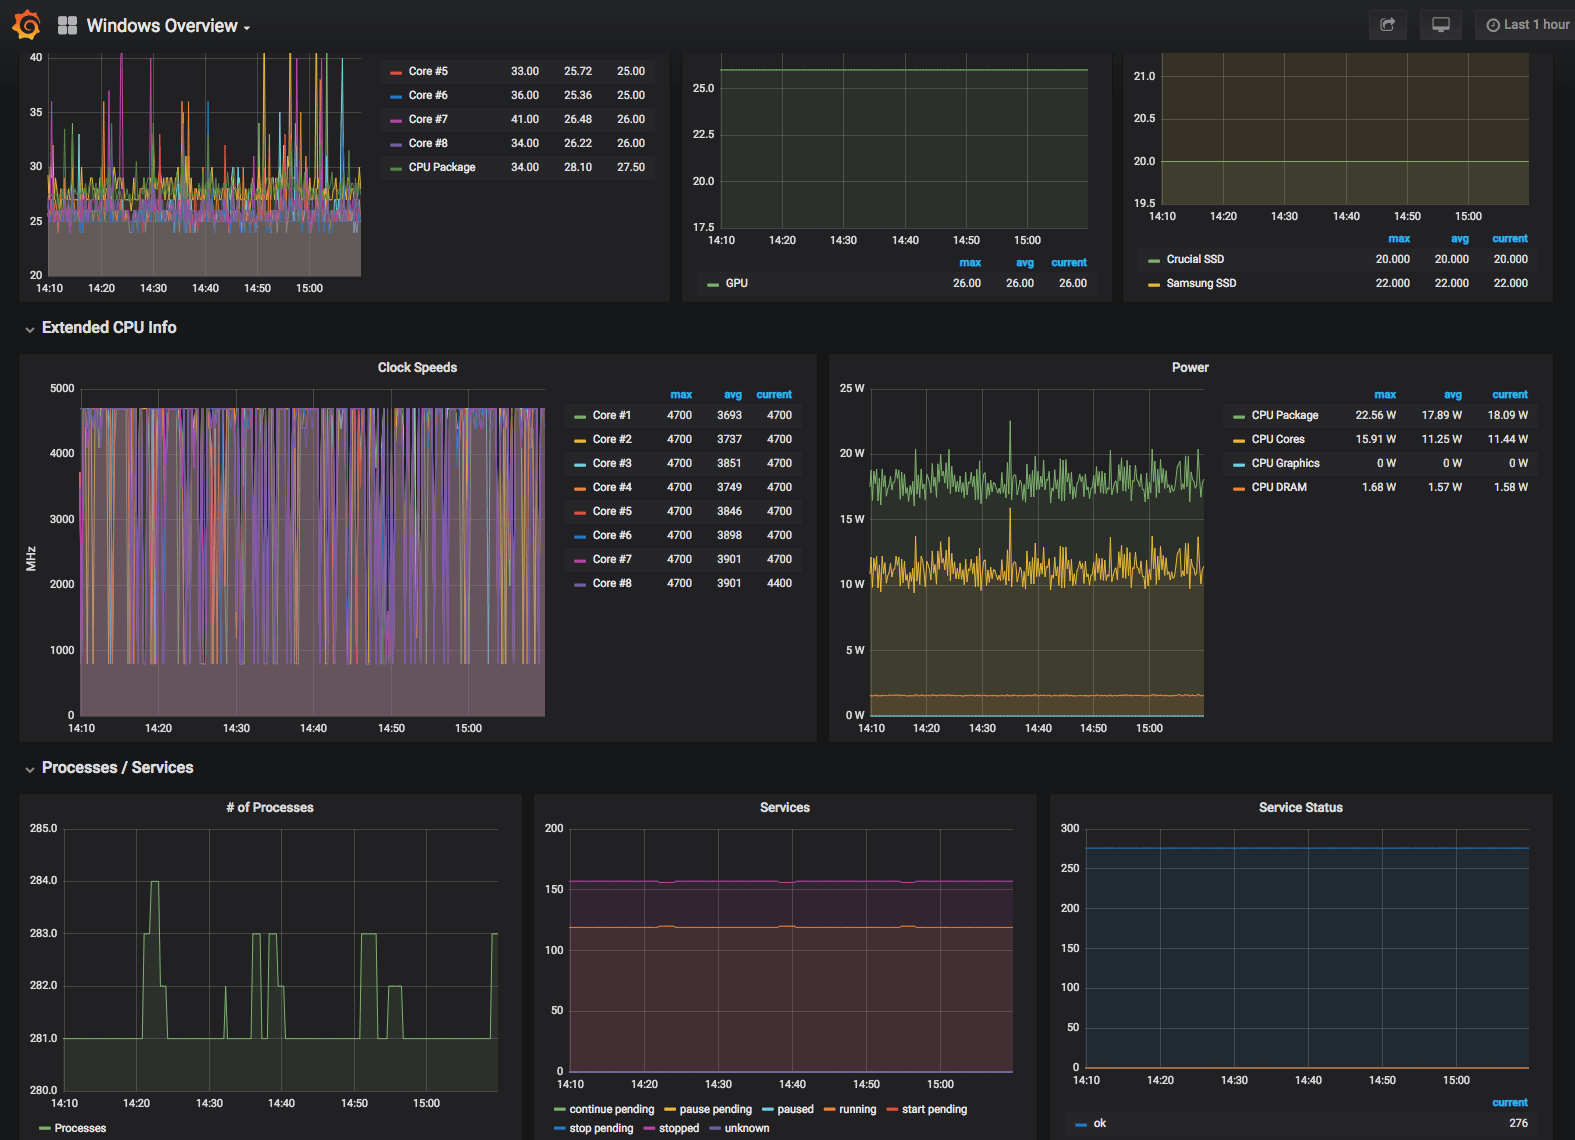
Here is a quick breakdown of the tools I am using to make this work and a live look at the Grafana dashboard.

Prometheus

I am using a standard install of Prometheus on my little home server. If you wanted to you could easily run this on your actual PC using Docker but I wanted to allow external access without opening any public access to my PC.

wmi_exporter

Most of our metrics are coming from the wmi_exporter. I am just using the default collectors it enables and that has given me most of the information I have wanted.

OhmGraphite

The one area that wmi_exporter does lack is GPU information and tempatures. Luckily OhmGraphite can pull this information for us and export it for Prometheus to read. Sadly it does not follow all the standards for metric/label naming for Prometheus so building dashboards can get a little weird. Update: This has been addressed in v0.9.0 here!

Grafana

Now to finally tie it all together and display it nicely is Grafana. I exported a copy of my dashboard here.

Live Example

Here is a live example of my dashboard up and running with actual metrics. Also some screenshots:

This was a brief overview of my monitoring setup. If you have any specific questions please feel free to reach out.

One-Off Script: Fix Yoast SEO Redirects When Switching Permalink Structure

If you use Yoast SEO to manage redirects and you change your permalink structure you may need to update a large amount of your redirects.

Here is a small simple script to help with that. This was made for when you switch from https://www.sethryder.com/2018/10/31/sample-post/to https://www.sethryder.com/sample-post/. If you are switching to something else it should be easy to modify, you will just need to update the regex in the preg_replace.

The two rows you will want to run through this script in your database are the wpseo-premium-redirects-export-plainand the wpseo-premium-redirects-basein wp_options. I assume they may vary if you are not using the premium version of the plugin.

This script will take the serialized options in the database (that you copy into the expected text files) and go through them and remove/update the redirect links. Once finished it writes them to the new files and you can replace the rows in your database.

WordPress: Switching Permalink Structure

Recently I had to migrate a blog from its own subdomain to the primary domain in a directory (Example: blog.domain.com to www.domain.com/blog).

Migrating a blog to a different domain is easy enough and I have done it countless times. The twist this time is that they also wanted to switch the permalink structure from https://www.domain.com/2018/10/30/sample-post/to https://www.domain.com/sample-post/.

After some quick research it appears there are few plugins for WordPress that will help you with this. But even some of them require manually setting up redirects for each blog post. Also I like to avoid unnecessary plugins as this adds more to maintain, especially when you are managing a large amount of sites.

So the easiest way to do this is just with a simple rewrite/redirect. Here is what I am using in nginx:

Make sure you update to the new permalink structure right before placing the rewrite rule as this will cause 404 errors if you haven’t switched to the new structure.

This should be easy enough to do with Apache and moving from other date based permalink structure. 

Give me a shout if you have a question and I will see if I can answer it.

Blackbox Exporter: Accessing Multiple Modules and Targets With a Single Job

In the past year I moved our teams entire infrastructure monitoring from Nagios/collectd to Prometheus. The amount of visibility into our infrastructure it has provided that we didn’t have before has been invaluable.

We host a bunch of small WordPress and other custom built websites (along with a couple very large sites) that we use the Blackbox exporter to monitor the response code and SSL Certificate status. I wanted to be able to keep all the sites we monitored in two files without having to modify the prometheus.yml every time I needed to add or remove a site which could require a reload of Prometheus.

I ended up using the file based service discovery for this. I had to dig quite a bit to find an example (which I think I found in a Github issue). Someday I want to expand this to use proper service discovery (like we do for all the other exporters) but I wanted something simple to start.

Below is examples how I have this setup in the Prometheus and Blackbox exporter configs.

1) Add the blackbox exporter job to the prometheus.yml file:

2) Then we need to configure the Blackbox Exporter on how to handle our two config files (one for http one for https):

3) Finally our last two configs. These are the actually lists of sites that the blackbox exporter will be monitoring.

That should be it. Any changes you make to either of the http_2xx.yml or https_2xx.yml config will automatically be picked up by Prometheus based on your scrape_interval setting.

Feel free to give me a shout if you have any questions or issues.